
WALLABY Pre-pilot Survey: The Effects of Tidal Interaction on Radial Distribution of Color in Galaxies of the Eridanus Supergroup.
Wang et al. 2022. ApJ, DOI:10.3847/1538-4357/ac4270
The Westerbork Coma Survey. A blind, deep, high-resolution H I survey of the Coma cluster.
Molnár et al. 2022 A&A, DOI: 10.1051/0004-6361/202142614
Dpt. Astronomía Extragaláctica
Instituto Astrofísica Andalucía
Glorieta de la Astronomía s/n
18008 Granada
Spain
Star formationIsolated Galaxies Compact Groups Optical colors of isolated galaxiesThe optical colors of galaxies reflect their stellar populations and these colors correlate with morphology and environment. The color-luminosity relation shows a strong bimodality with clear separation into red and blue sequences, corresponding roughly to early- (E, S0, and Sa) and late-type (Sb, Sc, and Irr) galaxies, as expected from the respective dominance of old and young stellar populations. Here, we present a first look at SDSS (g-r) colors of isolated galaxies in the AMIGA sample. To check the effects of environment in the colors, we have compared the AMIGA colors with those obtained in other three samples: The nair & Abraham sample and the Efigi catalogue, without any selection of environment; and a catalogue of Pairs of galaxies.
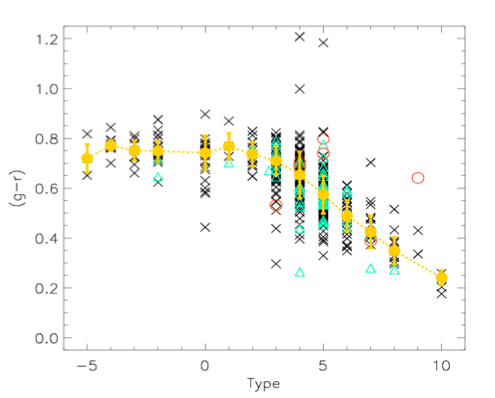
Fig. 1 Distribution of the rest-frame (g-r) color as a function of Hubble type. The yellow points are the median values of each morphological type. The blue triangles are objects with asymmetries while the red open points represent objects suspected of being involved in interactions. The error bars represent the median absolute deviation. In the figure above we show the distribution of AMIGA colors as a function of the morphological subtype. Not surprisingly, the reddest median values of (g-r) are found for the first four bins, which represent early-type galaxies, although median (g-r) values remain essentially constant out to T=3 (Sb). Beginning with type Sb we see a decrease in median (g-r) as expected if this sequence reflects a uniformly decreasing contribution from an old stellar population. We expected to find a lower color dispersion for spiral subtypes in the AMIGA sample because these galaxies are minimally affected by environmental effects, which apparently induce a higher color dispersion.
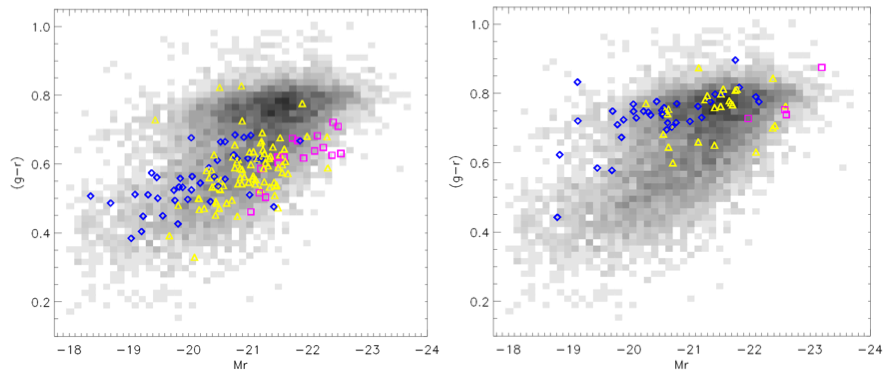
Fig 2 (g-r) color-magnitude diagram for the Sc (left) and the E/S0 (right) galaxies in the AMIGA sample. The blue diamonds are objects at z<0.02, the yellow triangles are galaxies at redshift 0.02 To study the source of this dispersion, we represented the color versus absolute magnitude in the r-band for Sc galaxies and early-types in the figure above. In grey scale, we have represented the sample of Nair & Abraham for all morphological types, so we can see the red and the blue sequences, that correspond to early and late type galaxies respectively. We found that our sample of Sc is distributed following the blue sequence, so the major source of color dispersion is the color-luminosity trend. But here, we identified a problem with the SDSS data because there is a bias of color versus redshift. This happens because the aperture used for the largest objects do not enclose the whole galaxy, so the contribution of the blue disk to the color is lower than it must be. We do not see this effect for early-types because they do not present this gradient of color.
|